Ready to turn SEO data into rankings that stick? This guide shows how to build an analytics dashboard that transforms keyword research, search trends, and SEO reporting into clear actions. See which pages win, which queries surge, and where to double down. Whether you lean on keyword research tools, analytics software, or full marketing dashboards, and even those well-thumbed SEO books, you’ll learn the exact metrics to track, visualize, and optimize. Pin it, test it, and watch your traffic climb with data you can actually use.
Building an Analytics Dashboard That Surfaces Search Trends

Imagine opening your laptop, coffee in hand, and seeing a single, beautiful analytics dashboard that whispers exactly what your audience is hungry for this week. Start by choosing flexible analytics software you actually enjoy using—Looker Studio, Tableau, or Power BI all play nicely with the usual suspects—and connect your core SEO data sources: Google Search Console for queries and positions, and GA4 for on-site engagement. Map a few non-negotiable tiles first: impressions, clicks, CTR, average position, and a tidy split of branded vs. non-branded. Then add a panel that spotlights search trends using week-over-week and month-over-month deltas, so rising queries glow and fading ones dim. I love layering 7-day and 28-day moving averages; it turns noisy spikes into a calm, readable rhythm.
Your keyword research deserves its own cozy corner. Build a cluster view that groups queries by intent—how-to, comparison, local—and tag them with content status like “idea,” “draft,” or “updated.” Pull in insights from your favorite keyword research tools to surface opportunity gaps and competitor overlap, and let the dashboard flag terms where your rank is teetering between pages 2 and 1. Add device and country filters at the top so you can glide between mobile discoveries and desktop patterns without rebuilding anything. A tiny “seasonality” strip chart can work wonders—those subtle waves reveal when to refresh gift guides, evergreen tutorials, or trend-driven roundups.
Because SEO reporting should be repeatable, bake in a rhythm. A weekly snapshot card for quick standups, a monthly trend story with annotations, and a quarterly content winners gallery for stakeholders who love marketing dashboards. Use notes to mark experiments—new title tests, internal link pushes, schema tweaks—so wins have receipts. If you’re a tactile learner, keep a few favorite SEO books nearby for frameworks, and don’t be shy about leaning on templates from your analytics software marketplace to speed setup. And yes, small comforts help: a sturdy laptop stand keeps your screen at eye level while you lose yourself in the details.
When your analytics dashboard is this thoughtful, keyword research stops feeling abstract. It becomes a living map of search trends, guiding which posts to optimize today, which ideas to draft tomorrow, and how to tell a clear, confident story in every piece of SEO reporting you share.
Keyword Research Foundations: From Seed Lists to SERP Intent
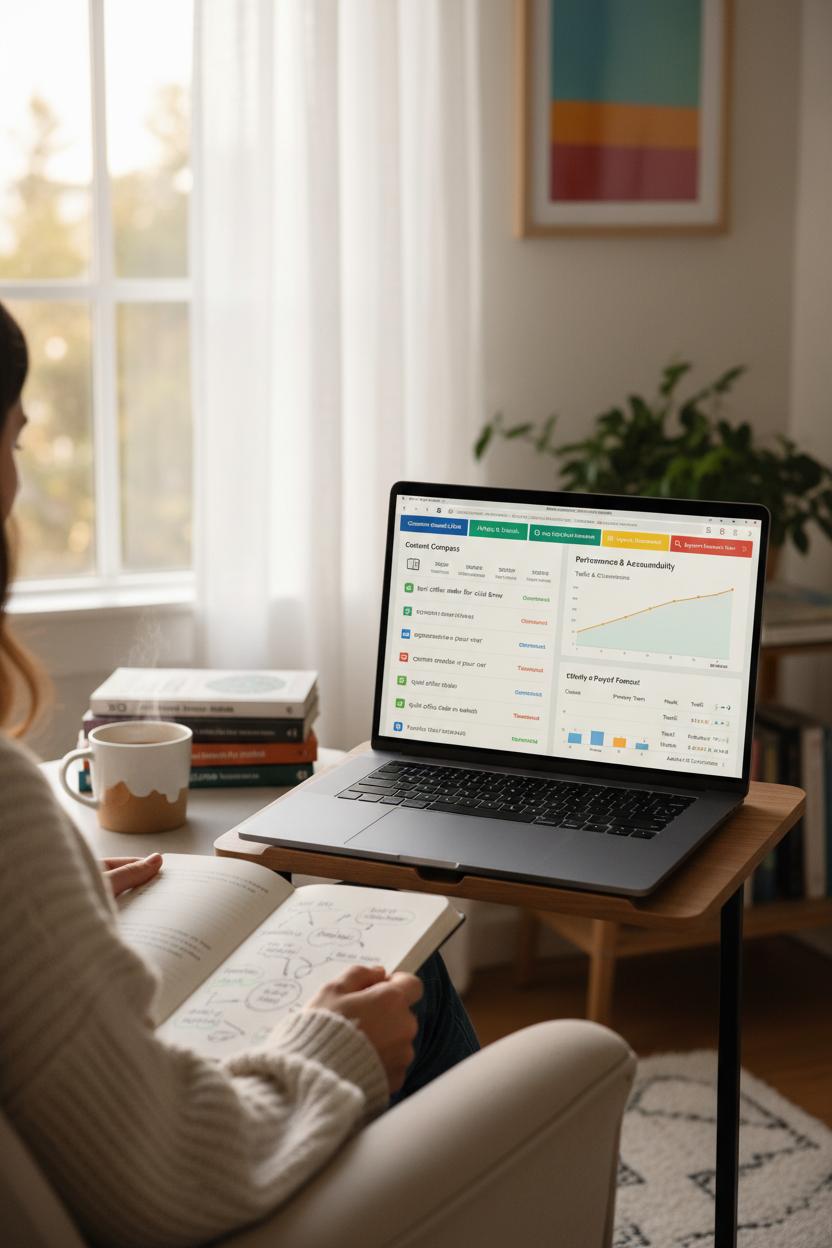
Start with a cozy seed list, the kind you jot down while sipping coffee and scrolling through customer emails, FAQs, and social DMs. Those real phrases are the heartbeats of keyword research. Sprinkle in inspiration from autocomplete, People Also Ask, and related searches, then sanity-check with your favorite keyword research tools to confirm volume and difficulty. I like to group by themes—problems, comparisons, and “ready to buy” phrases—because tidy clusters make it easier to plan content in batches. If you’re a book learner, a couple of well‑thumbed SEO books can give you frameworks to spot gaps between what you offer and what people actually type. Keep it simple: start broad, then prune ruthlessly until only the highest-intent branches remain.
Next comes mapping to intent, where your list turns into a content compass. Open your analytics dashboard and layer in SEO data like current rankings, click-through rates, and conversions. Label each keyword with an intent tag—informational, commercial, transactional, or local—and note the dominant SERP features you see: guides, comparison tables, product carousels, or maps. When SERPs are teaching, plan tutorials and checklists; when SERPs are selling, craft comparison pages and buyer’s guides. Watch search trends for seasonality and surges, so you can pre-bake content before interest peaks. This is where analytics software and marketing dashboards shine: unify impressions, engagement, and revenue so you’re never guessing which cluster deserves your next piece of content.
Finally, make it accountable with SEO reporting that feels like a habit, not a chore. Track each cluster’s primary and secondary terms, the pages mapped to them, and a simple forecast of effort versus payoff. A weekly snapshot—rank changes, traffic, and assisted conversions—keeps you honest and agile. If you love a tidy workspace, prop your laptop on a comfy laptop stand, color‑code your tabs, and let the dashboard become your creative studio: ideas in, insights out. Over time, your once-messy seed list evolves into a living strategy, guided by SERP intent and validated by SEO data, so every new post has a job, a measurement plan, and a clear place on your analytics dashboard.
Tools of the Trade: Choosing Keyword Research Tools and Analytics Software

Choosing the right stack for your SEO data is a bit like curating a capsule wardrobe—timeless pieces that mix and match beautifully. Start with keyword research tools that make you feel both confident and curious. Look for clean interfaces, trustworthy search volume and difficulty scores, click-through potential, and the ability to peek at SERP intent and seasonality so you don’t miss those subtle search trends that swell before a launch or holiday. I love pairing one primary tool with a secondary source to cross-check ideas; it’s amazing how a second opinion can spark a fresh angle for keyword research. If you’re new, browsing a few SEO books can help you understand the “why” behind the numbers, so you’re not just collecting phrases—you’re building a story your audience actually wants to read.
Next, bring it all home with analytics software that talks seamlessly to your analytics dashboard. Your dashboard is the cozy living room where all your metrics come to mingle—traffic, rankings, conversions, and those little leading indicators that whisper what’s working. Bonus points if your tools integrate into broader marketing dashboards, so SEO reporting sits right alongside email, social, and paid campaigns. Set up goals, events, and UTM frameworks early, and don’t be shy about custom dimensions for things like content categories or intent buckets. Automations—like weekly snapshots of top movers, alerting on sudden drops, or tagging new pages—turn your data into a steady rhythm instead of a scatter of screenshots. And because a calming workspace genuinely helps you think, prop your laptop on a simple laptop stand, light a candle, and make review time a ritual. The right blend of keyword research tools and analytics software doesn’t just track progress; it shortens the distance between insight and action. You’ll start recognizing patterns faster, updating pages with confidence, and weaving your findings back into content calendars and briefs without the guesswork. That’s when SEO reporting stops feeling like homework and starts feeling like styling—each tweak refined, intentional, and aligned with the bigger look you’re after.
Visualizing KPIs: Marketing Dashboards for SEO Reporting
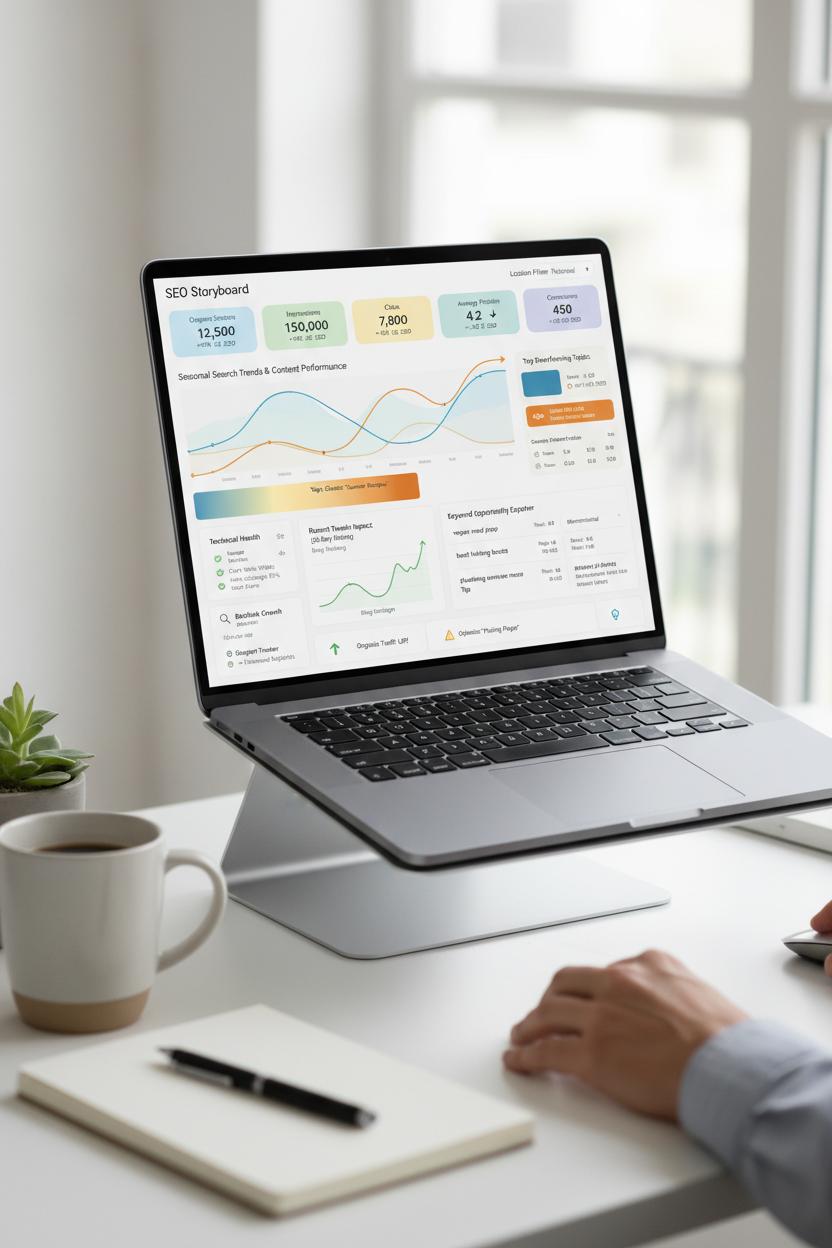
Think of your analytics dashboard as a mood board for your SEO data—clean tiles, soft colors, and trend lines that tell a story at a glance. When marketing dashboards are set up thoughtfully, your KPIs feel less like a spreadsheet and more like a living, breathing picture of performance. Start with the essentials: organic sessions, impressions, clicks, average position, CTR, and conversions. Layer in search trends so you can see how seasonal interest ebbs and flows, then map those trends to content clusters and landing pages. A simple heatmap can reveal which topics overperform, while a rolling 28-day line chart highlights whether recent tweaks actually moved the needle. This is SEO reporting that feels intuitive: charts that calm the chaos and make it obvious where to focus next.
Next, bring keyword research into the frame. Create a widget that pairs opportunity keywords with their current rank, difficulty, and potential traffic so the “what to write next” decision becomes a swipe-right moment. Group terms by intent—informational, transactional, local—and watch your content pipeline fall into place. Add a card for technical health (Core Web Vitals, index coverage, and crawl errors) and a mini-panel for backlink growth to keep authority in view. If you use keyword research tools or analytics software, plug them in so the dashboard pulls in fresh metrics automatically. Bonus points for a snippet tracker that flags when you gain or lose featured results, and a location filter to separate local performance from national reach.
Finally, make it ritual-worthy. Picture this: morning coffee, a neat workspace, your laptop stand tilting the screen just right, and a five-minute scan of your KPIs before you plan the day. Save a “Wins, Risks, Next” snapshot for weekly SEO reporting—three concise visuals that stakeholders love. If you’re building from scratch, lean on marketing dashboards templates and skim a few SEO books for measurement frameworks that stick. Keep the palette friendly, use consistent iconography, and write human labels for every chart. The goal isn’t just to track; it’s to translate. When your dashboard turns numbers into narratives, you’ll know exactly which pages to refresh, which queries to chase, and which stories your audience is ready to discover.
Learning and Leveling Up: Best SEO Books and Resources

When you’re ready to go from dabbling to deliberate, curl up with a mug, prop your laptop on a comfy laptop stand, and treat yourself to a mini study session that feeds your dashboard brain. A few timeless SEO books can change how you see patterns in SEO data and how you tell stories with them. The Art of SEO is a deep dive into foundations that still matter when you’re building an analytics dashboard. Product-Led SEO helps connect rankings to real business growth, so your SEO reporting doesn’t stop at impressions—it translates into strategy. If you want a practical refresh, titles like SEO 2024 are great for turning keyword research into roadmaps grounded in search trends and user intent. Pair your reading with hands-on play: explore keyword research tools to see how difficulty, volume, and SERP features show up in your queries, then mirror those insights in your charts and scorecards.
Beyond books, make a routine of checking the sources your dashboard depends on. Google’s Search Essentials and the documentation for Search Console, GA4, and Looker Studio are must-reads if you want cleaner pipelines and clearer KPIs. Subscribe to Aleyda Solis’s #SEOFOMO and the Moz Top 10 to spot algorithm shifts and emerging search trends before they nudge your numbers. Podcasts like Crawling Mondays and the Search Engine Journal Show are perfect for hearing how practitioners translate messy SEO data into crisp SEO reporting that executives actually read. If you’re experimenting with analytics software, take the free GA4 and Looker Studio courses to sharpen attribution, filters, and blending—skills that make marketing dashboards sing. Keep a sandbox property where you can test new templates, connectors, and calculated fields, then graduate the winners into your live analytics dashboard. Finally, don’t underestimate community: lurk in r/SEO and analytics Slack groups to peek at real troubleshooting threads, discover niche keyword research tools, and borrow clever visualizations for your own marketing dashboards. Learning in public, iterating in private, and reading widely is the quiet rhythm that compounds—one chapter, one chart, and one small improvement at a time.
Case Study: How an Analytics Dashboard Boosted Our Rankings

When our traffic plateaued last spring, I stopped doom-scrolling and started listening to the numbers. I cleared my desk, set my laptop on a trusty laptop stand, brewed a cinnamon coffee, and opened the analytics dashboard we’d stitched together from our analytics software. It wasn’t fancy—just one of those clean, color-coded marketing dashboards that pulled in SEO data, surfaced search trends, and kept our SEO reporting in one cozy home. Almost immediately, a pattern popped: our “how-to” guides were earning impressions, but we were missing the long-tail intent behind them. People were asking for step-by-step checklists, printable templates, and side-by-side comparisons. The dashboard’s query filters made it painfully obvious: we were close, but not quite answering the question.
So we treated it like a makeover. Using our favorite keyword research tools, we rebuilt outlines around intent clusters, added FAQs where the search trends hinted at hesitation, and rewrote intros to match the way real people actually speak. I pulled a few dog-eared pages from my SEO books for internal linking ideas, then grouped related posts into topical hubs with tighter anchor text. We refreshed images, trimmed fluff, and scheduled weekly SEO reporting right inside the analytics dashboard to keep us honest. Within eight weeks, the needles moved: more top 3 spots, click-through rates up on our mid-tail terms, and a handful of featured snippets we’d been eyeing forever. The magic wasn’t a secret hack—it was seeing everything together, every day, in one calm view that nudged us to fix what mattered first. If you’re stuck, build a simple dashboard that blends your analytics software with keyword research, set alerts for trend spikes, and let the data guide your next tiny action. It’s the Pinterest-y version of progress: small, consistent tweaks that add up to a room you love walking into—and rankings that finally reflect your effort.
Checklist: Launch Your SEO Data Dashboard in 7 Steps

Pour a fresh coffee, clear a little space on your desk, and let’s spin up your analytics dashboard in seven cozy, confidence-boosting steps. 1) Define your purpose: write down the exact questions your SEO data needs to answer, like which pages drive conversions, which topics need love, and where your audience is drifting based on search trends. 2) Collect your sources: connect Google Search Console, GA4, your rank tracker, and any CRM or ad platforms so you’ve got a single stream of truth for impressions, clicks, sessions, revenue, and technical signals. 3) Pick your tools: choose analytics software and marketing dashboards you actually enjoy using—whether that’s Looker Studio, Tableau, or Power BI—and keep your favorite keyword research tools handy for on-the-fly keyword research. A comfy laptop stand goes a long way when you’re nesting into a build session.
Now comes the fun, visual part. 4) Design your layout: start with a top row of KPIs (traffic, conversions, revenue), then add time-series charts for trends, a section for keyword clusters and rankings, and a content health panel for internal links, page speed, and crawl status. Think clean, airy spacing, a gentle color palette, and intuitive filters by country, device, and segment. 5) Map your metrics: be crystal clear about definitions—branded vs. non-branded, landing page vs. query views, average position vs. weighted rank—and label every chart so future-you (and teammates) instantly understand what’s what. 6) QA and share: spot-check daily and weekly totals against source platforms, test filters, and run a week-over-week sanity pass before you ship. Then set up automated refreshes and a simple cadence for SEO reporting, like a Friday snapshot and a month-end digest. 7) Iterate like a creative routine: bookmark insights, annotate algorithm dates, and refresh your content ideas with the help of SEO books and those trusty keyword research tools; add new widgets as patterns emerge in your search trends and keep pruning anything that no longer earns its spot. Your dashboard isn’t a one-and-done—it’s a living, breathing guide that grows with your strategy, making every optimization feel a little more intentional and a lot more delightful.
Conclusion
Here’s your warm takeaway: brew a coffee, open your analytics dashboard, and let SEO data whisper what to do next. Turn keyword research into a simple weekly ritual, watch search trends like the seasons, and use SEO reporting to spot quick wins and long-game growth. When everything lives in one place, insights become action—content ideas, on-page tweaks, and smarter links that steadily lift rankings. Pin this plan: check metrics, choose one move, celebrate progress. Cozy, consistent, data-led—your roadmap to results.